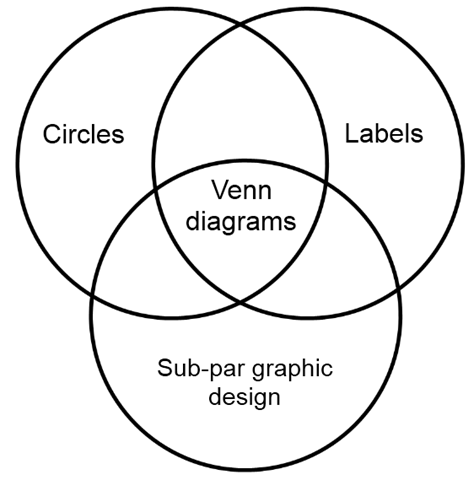
Venn diagrams are a combination of three elements: circles, labels and sub-par graphic design.
Named after their inventor, Tony Diagram, VDs are a popular, effective and fun method of conveying information about the constituent parts of any phenomena.
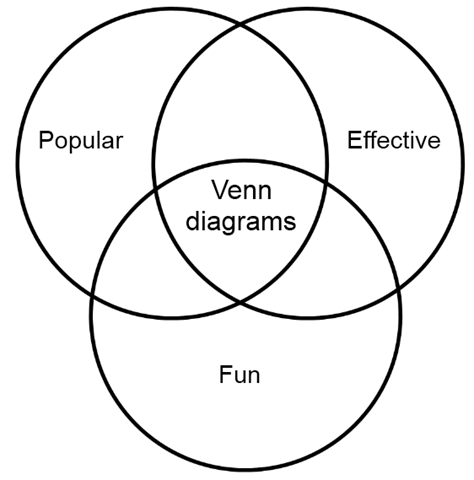
Venn diagrams are so simple to create and interpret they don’t even need explaining.

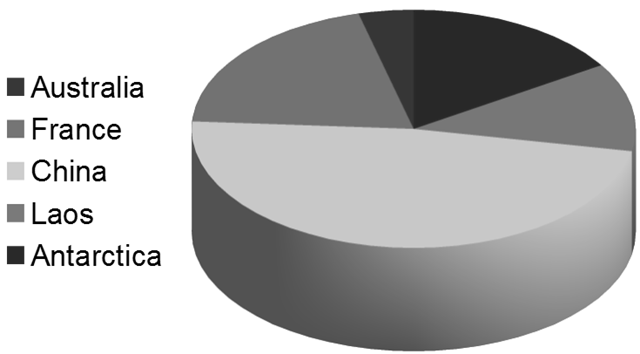
The simple but well-meaning cousin of the Venn diagram is the pie chart. These delicious, inedible diagrams show the constituent parts that contribute to a whole phenomena.
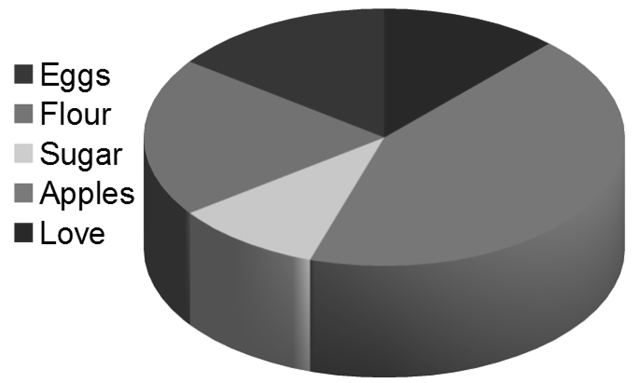
Pie charts can display information about more than pies. They are used to encapsulate information about flans, tarts and dragon attacks.